

what goes on a marketing dashboard?
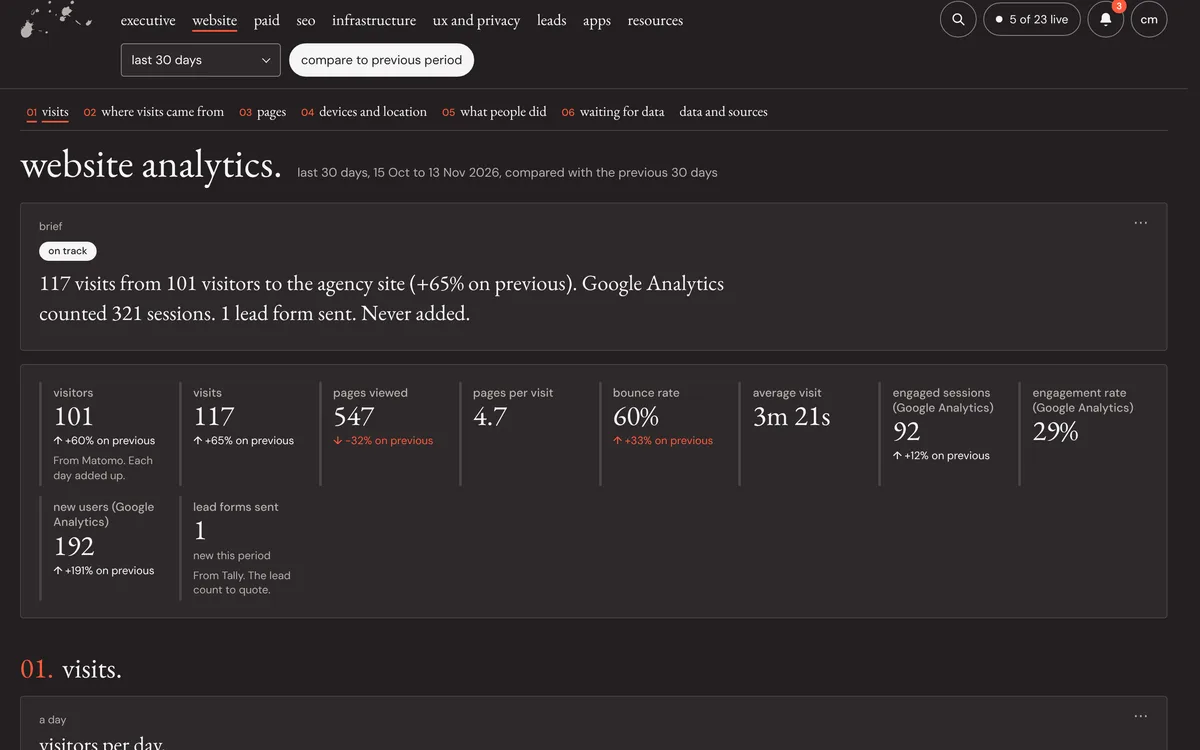
four numbers on the first screen: spend, visits, leads and cost per lead, each against the last period. then one tab for each channel, and a line that says what changed. most other numbers can stay off.
the first screen.
- spend: what went out across every paid channel.
- visits: people on the site, with your own visits left out.
- leads: enquiries that reached you, counted the same way every time.
- cost per lead: spend divided by leads. the one number that tells you if the marketing is paying.
each one shown against the last period, with an arrow that says whether the change is good or bad. a higher cost per lead is red even though the number went up.
a worked example.
spend $2,000 in a month and get 16 leads, and cost per lead is $125. if 1 in 4 leads becomes a customer, each customer cost $500 in marketing. those three numbers, spend, leads and cost per lead, are the ones to watch week to week; the customer figure tells you whether $125 a lead is worth paying.
one tab per channel.
- paid: spend, clicks, leads and cost per lead by campaign, and the search terms costing the most.
- search: clicks and impressions from search console, average position, and the pages people land on.
- site: visits, how many become leads, speed, and whether the site stayed up.
- leads: where each lead came from and what happened to it in the crm.
marketing dashboard examples.
- an owner's dashboard: the four numbers, a tab per channel and a weekly brief.
- a paid search dashboard: spend, clicks, leads and cost per lead by campaign, plus the search terms costing the most.
- a website dashboard: visits, where they came from, top pages and what people did.
- a lead dashboard: every lead's source, counted once, and what happened to it in the crm.
what changed.
a short note at the top in plain words: what moved this week and what to do about it. without it, a dashboard is a page of numbers that everyone reads differently.
what to leave off.
- impressions and likes on their own. they rise and fall without telling you much.
- bounce rate without context.
- forty charts. if nobody acts on a number, it doesn't need a spot.
how often.
the data can update every day so problems show up the day they start. read it weekly, and do a proper review once a month.
where the numbers come from.
google ads, ga4 or matomo, search console, your crm and your hosting. a dashboard joins them, so nobody logs in to six tools to answer one question. looker studio can do this for free; a custom build can check the numbers through the day and send an alert when something breaks.
how ink. can help.
ink. builds marketing dashboards for small and medium businesses. see what one covers.
questions.
what is a marketing dashboard?
a single screen that shows how your marketing is performing, pulled from the tools you already use, such as google ads, ga4, search console and your crm.
what should a small business marketing dashboard show?
spend, visits, leads and cost per lead, compared with the last period. then a tab for each channel and a short note on what changed.
is looker studio enough?
often, yes. it is free and connects to google's tools. a custom dashboard is worth it when you need data from tools looker studio can't reach, alerts, or a written summary each week.
what's the difference between a marketing dashboard and a marketing report?
a dashboard is live and checked through the day; a report is a document for a period, usually a month, with commentary. most businesses need both: the dashboard to spot problems, the marketing report to decide what to change.
how many numbers should a marketing dashboard show?
four on the first screen. each tab can hold more, but if nobody acts on a number, leave it off.
make your mark.
want one view of your marketing? get in touch for a free initial consultation.
get in touch.call christian.0434 ••• •••