

marketing dashboards, built for your business.
an ink. dashboard is one marketing reporting dashboard set up for your business: spend, visits, leads and cost per lead on one screen, pulled from the tools you already use and checked through the day. a short written brief at the top says what changed and what to do this week.
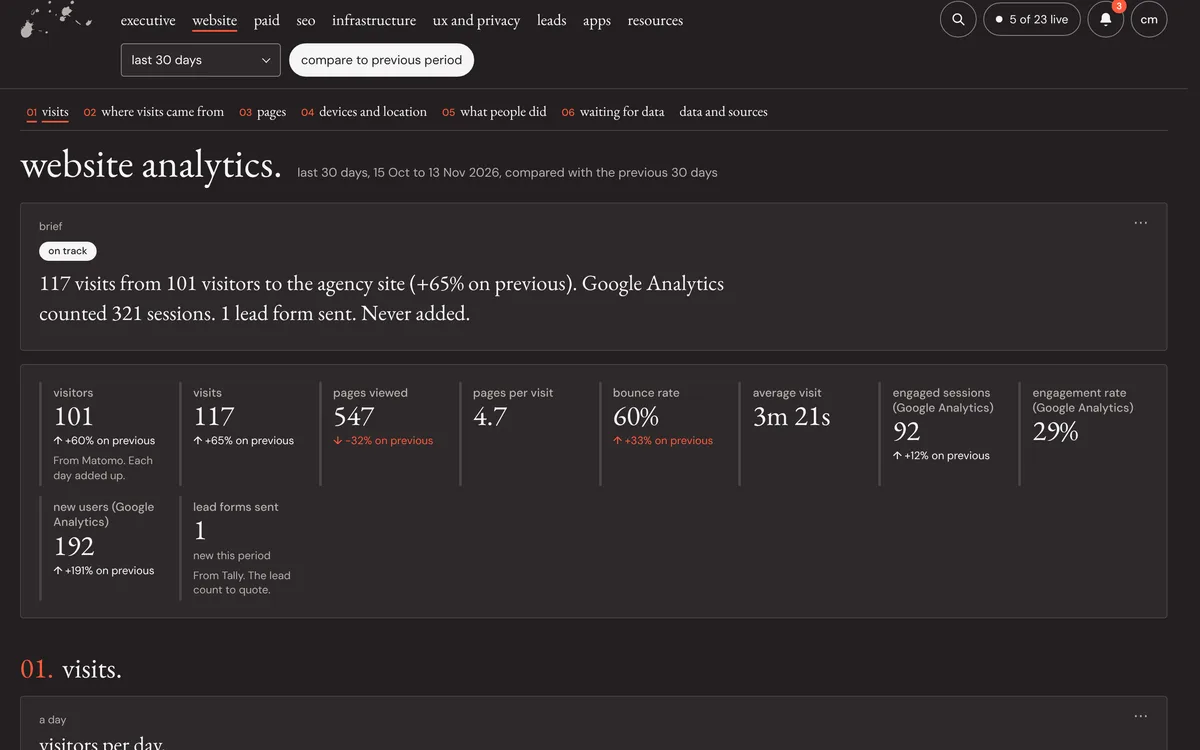
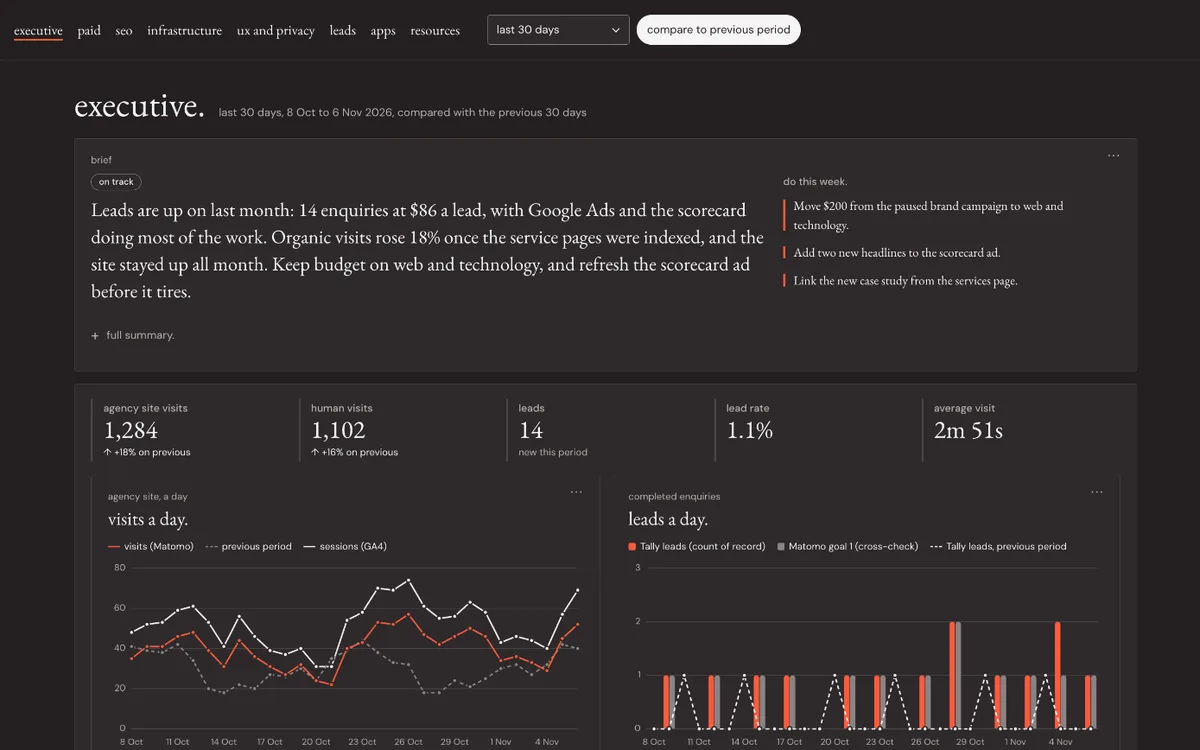
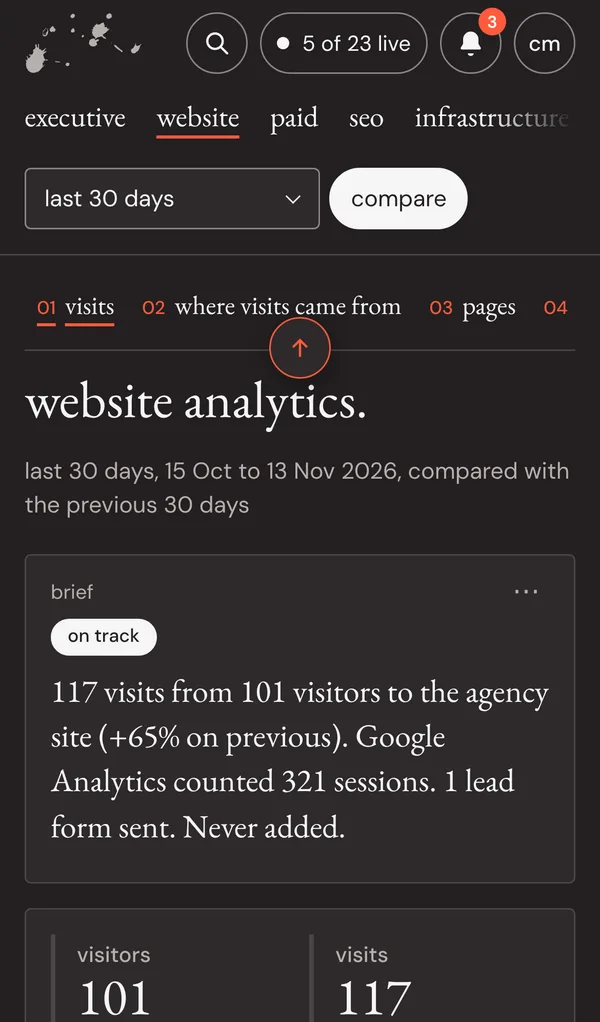
what's on it.
the first screen.
visits and leads against the last period, and spend and cost per lead once an ad account is connected. every number says where it came from.
a tab for each area.
website, paid, seo, infrastructure, ux and privacy, and leads. each tab opens with its own short brief.
a written brief.
a few plain sentences at the top: what happened, why, and what to do this week. written by claude from the numbers on the page, and it says where its figures came from.
alerts.
when a number moves out of its usual range, a check fails or a source stops sending data, it shows in the alerts list.
lead counts, side by side.
the form tool, the analytics tools and the ad platform each count leads their own way. we show their counts next to each other and never add them together, so one lead is never counted three times.
what it connects to.
| source | what it shows | checks |
|---|---|---|
| google ads | spend, clicks, conversions, cost per lead | every 6 hours |
| microsoft advertising | spend and conversions | every 6 hours |
| google analytics (ga4) | sessions, lead and tool events | every 15 minutes |
| matomo | visits, pages, goals and events | every 15 minutes |
| search console | clicks, searches, positions, indexing | every 6 hours |
| your form tool (tally) | form submissions | every hour |
| microsoft clarity | where people get stuck: rage clicks, dead clicks, quick backs | every 6 hours |
| your hosting and uptime monitors | uptime, disk and bandwidth, certificate and domain expiry | every minute to once a day |
| core web vitals | page speed, from google's field data and lab tests | daily |
| ahrefs or semrush | authority, backlinks and rankings | daily |
| your crm | where leads go after they arrive | every hour, once connected |
we connect what you have. a business without a crm or clarity simply doesn't get those tabs.
how it works.
- a call. we look at the tools you use and the numbers you're asked about.
- we connect your accounts. read-only access wherever the tool allows it.
- we set it up for your business. the first screen, the tabs, what counts as a lead, and what should raise an alert.
- we check the numbers. each figure is matched against the tool it came from before you see it.
- you get your sign-in. your own address, your own sign-in with two-step codes, and access for your team, down to single panels per person.
good at, and not.
good at.
- answering "is the marketing working?" in one place.
- catching problems the day they start.
- numbers that read the same for everyone.
- owners who don't want to log in to six tools.
not for.
- a business with one channel and one tool, where that tool's own report is enough.
- a team that wants to build its own charts every week, which suits looker studio better.
- agencies wanting white-label client reports.
who it's for.
owners and marketing managers of small and medium businesses who spend on ads, run a website that brings in enquiries, and want to know what the marketing returns. we're in melbourne and work with businesses across australia.
ink. dashboard, looker studio or reporting software.
| ink. dashboard | looker studio | reporting software (agencyanalytics, databox and similar) | |
|---|---|---|---|
| who sets it up | we do | you, or someone you pay | you |
| cost | quoted per business, paid once; yours once paid for | free | a monthly subscription; see their sites for current plans |
| sources | google, microsoft, matomo, forms, hosting, uptime, crm | google's own for free; others through partner connectors, many paid | many, through built-in connectors |
| who it suits | owners who want the answer, not the tool | teams who like building reports | agencies reporting to many clients |
looker studio is a good free choice when your data lives in google's tools and someone on the team enjoys building reports. we build in it too.
on a phone.
it works in the browser on any phone. add it to your home screen and it opens like an app; pull down from the top to reload.
questions.
what is a marketing reporting dashboard?
one screen that shows how your marketing is performing, pulled from the tools you already use, such as google ads, google analytics, search console and your website's forms. ours adds a written brief that says what changed.
how much does a marketing dashboard cost?
there's no set price. every business has a different set of tools, so we quote after a free initial consultation. you pay once to have it built, and then it's yours.
do i need google analytics 4?
no. we connect whichever of google analytics or matomo you use, and the dashboard shows where each number came from.
who can see it?
only the people you add. it sits behind your own sign-in with two-step codes, and each person can be given whole tabs or single panels.
can you just set up looker studio instead?
yes. if a free looker studio report is the right fit, we'll say so and build that.
related.
what goes on a marketing dashboard?
the first screen, a tab per channel, and what to leave off.
marketing reporting: what to report each month.
a one-page template for the monthly report.
cost per lead, cost per customer and what a lead is worth.
tracking, analytics and reporting.
make your mark.
want one view of your marketing? get in touch for a free initial consultation.
get in touch.call christian.0434 ••• •••